Compatibility
Windows 10 May 2020 Update or later is required (version 2004, OS build 19041). The included read-only Android companion requires Android 16 or later (API level 36+).
Track estimated dividend income, projected payment dates, holdings, daily movement, and capital gains from one Windows desktop portfolio built for dividend investors. Use the Android companion when you want a read-only view on your phone.
StockTracker is a Windows desktop app for tracking estimated dividend income and payment timing. This section summarizes the compatibility, licensing, update, support, and refund information that is useful before you install or purchase.
Windows 10 May 2020 Update or later is required (version 2004, OS build 19041). The included read-only Android companion requires Android 16 or later (API level 36+).
Free mode supports up to 5 positions. The paid version is a $20 one-time purchase that unlocks unlimited positions. The Android companion is included without a separate license.
Updates are free for free-mode and paid users. StockTracker checks for updates, notifies you, and lets you choose whether to download and install them. Internet access is needed for update checks, downloads, and market-data quotes, but not to install an update already downloaded.
Email stocktracker@fastmail.com for help. The developer aims to respond within a few days. Purchases include a 30-day money-back guarantee; reasonable later requests may be considered case by case. A refunded license is no longer valid.
StockTracker is portfolio-organization software, not financial, investment, tax, or legal advice. View the $20 product page when you are ready to purchase.
The StockTracker Windows installer is not currently digitally signed. Windows may therefore show a security warning the first time you open it.
Some Windows 11 security settings and organization policies may block unsigned applications without offering a Run anyway option. Do not disable Windows security broadly to install StockTracker; contact support if the official installer cannot be opened on your computer.
When the installer is digitally signed in a future release, this guidance will be updated. Until then, the official download source and the Windows warning are important parts of deciding whether to continue.
A StockTracker portfolio is a JSON file on your computer. Open an existing portfolio, import a brokerage export, or add positions and save a new one.
Use File > Open Positions when you want to switch to another saved portfolio file. Use File > Export Positions CSV when you want a spreadsheet-friendly copy of the current portfolio, including dividend yield, yield on cost, yearly dividend, and dividend income weight.
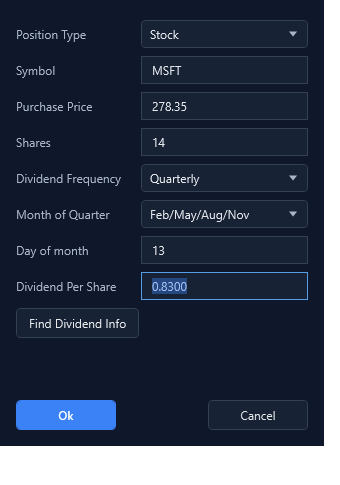
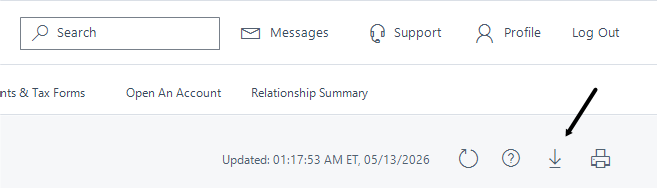
StockTracker imports position files exported from supported brokerages and flexible position spreadsheets. Export one account at a time, save the file locally, then choose File > Import Positions and select the exported file.
StockTracker runs in free mode until a license is activated. Free mode supports up to 5 positions. A free-mode badge appears in the main window while the app is unlicensed.
Select Help > Activate License when the app is unactivated, or use Settings > License at any time to manage the saved license key and see used and remaining activations. Activation is tied to the current Windows machine.
Existing portfolios with more than 5 positions still open in free mode, and import remains available so you can replace or reduce the portfolio. Market data fetching is disabled until the portfolio has 5 or fewer positions or a license is activated.
Use the license dialog, limit dialog, or About box to open the StockTracker store page.
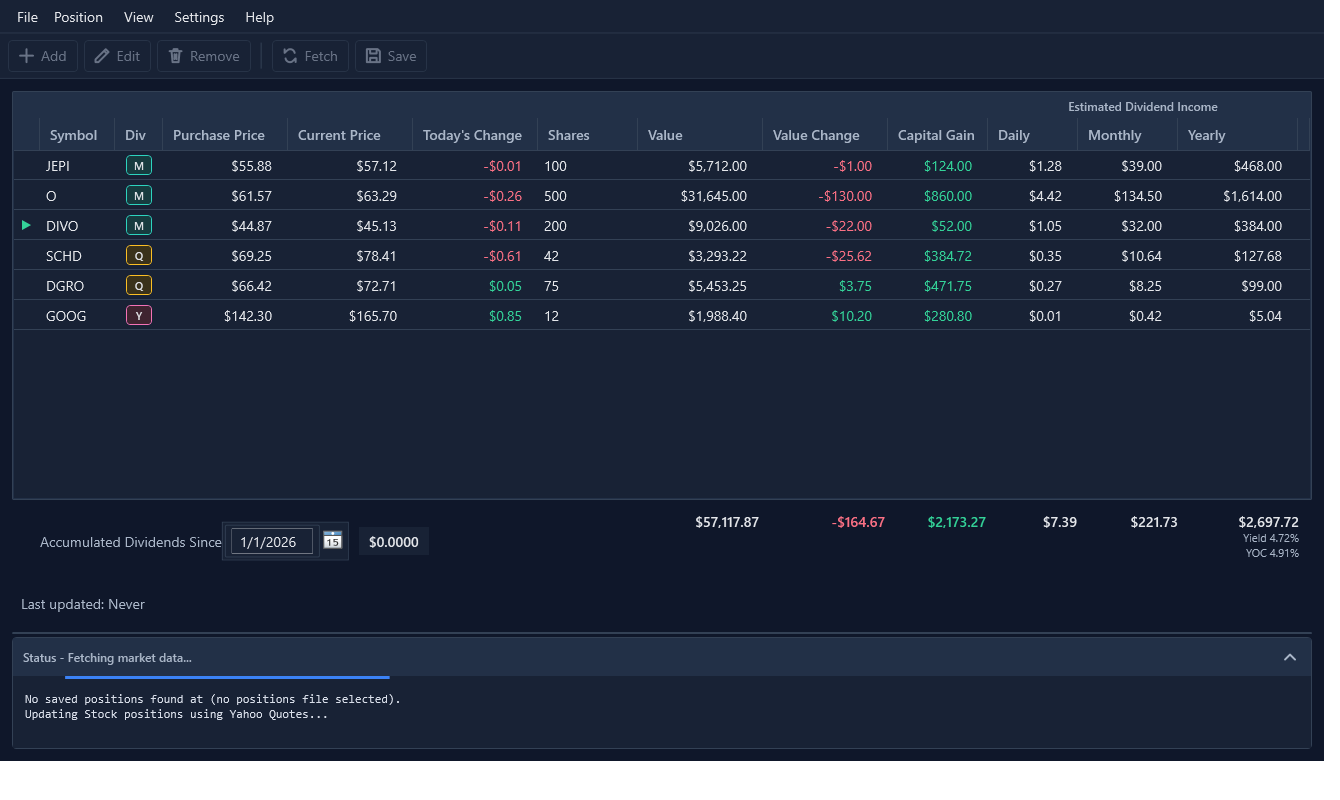
The main table shows each position with the values StockTracker calculates from your saved data and the latest market data, with dividend timing kept visible while you scan the portfolio.
Current Price, Today's Change, Value, and Value Change update when market data is fetched.
Capital Gain compares the current value against the purchase price and share count you entered.
Daily, Monthly, and Yearly are estimates based on the dividend amount currently saved for each position.
The M, Q, and Y badges mark monthly, quarterly, and yearly dividend schedules. Quarterly badge tooltips include the saved month-of-quarter group, such as Jan/Apr/Jul/Oct.
The green arrow at the left marks every position tied for the next estimated dividend payment. Projections preserve the saved day-of-month pattern, support an explicit end-of-month rule, clamp dates to shorter months, and move estimated weekend dates to a weekday within the same month.
The arrow becomes a green star when the estimated dividend payment is due today.
The bottom totals strip shows two portfolio-level dividend percentages below the yearly dividend total.
Open Dividend Investing for beginner-friendly terminology, formulas, and rules of thumb.
Use these tools to complete dividend details and inspect values without adding more columns to the portfolio table.
Use free public lookups to fill in dividend timing and amount details for stock positions.
Hover a position row to see extra dividend and movement details without adding more table columns.
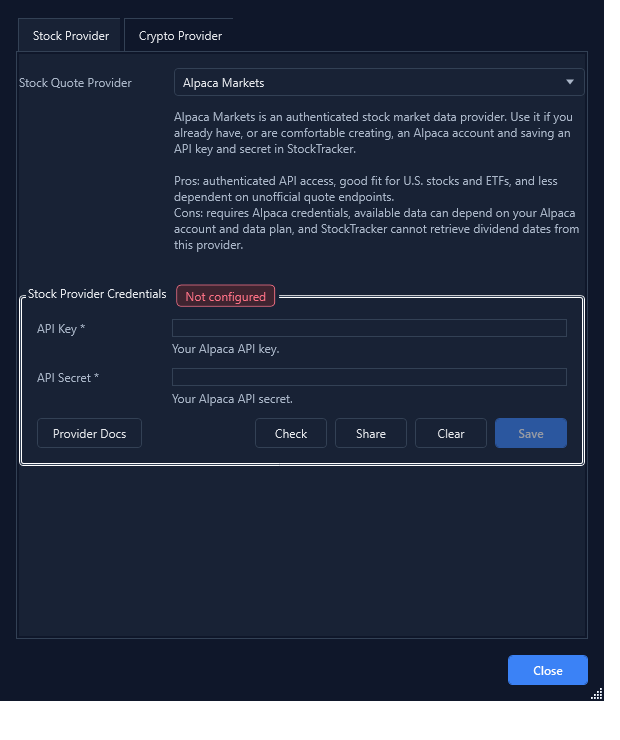
Use Fetch or press F5 to refresh prices. StockTracker supports Yahoo Quotes and Alpaca Markets for stocks, and CoinMarketCap for crypto.
Best when you want the easiest stock setup: no credentials are required, and dividend dates are included when Yahoo provides them. Yahoo quote access can occasionally fail outside StockTracker's control; switching to Alpaca Markets is the practical workaround until Yahoo access works again.
Best when you already have Alpaca API credentials or prefer an authenticated stock data source. Alpaca updates stock prices and previous close values, but it does not provide dividend dates.
Used for crypto positions. CoinMarketCap requires an API key and updates crypto prices separately from the selected stock quote provider.
Automatic Fetch helps keep your portfolio history current on days when you forget a manual fetch or are away from home. Open Settings > Automatic Fetch to enable it, choose the days, and set the local time after which the fetch should run.
Monday through Friday are selected by default. You can select or clear any day, including Saturday and Sunday.
StockTracker fetches only when no successful market-data fetch has already happened on that day. A manual or startup fetch satisfies the schedule.
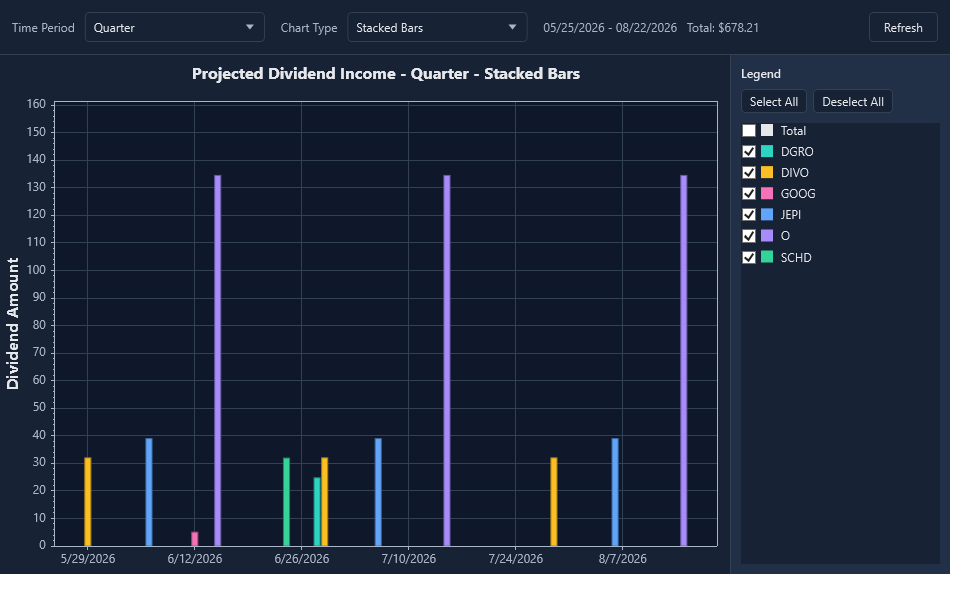
The dividend income chart turns saved dividend schedules into a forward-looking payment calendar, so you can see when income is expected instead of only viewing daily, monthly, and yearly estimates.
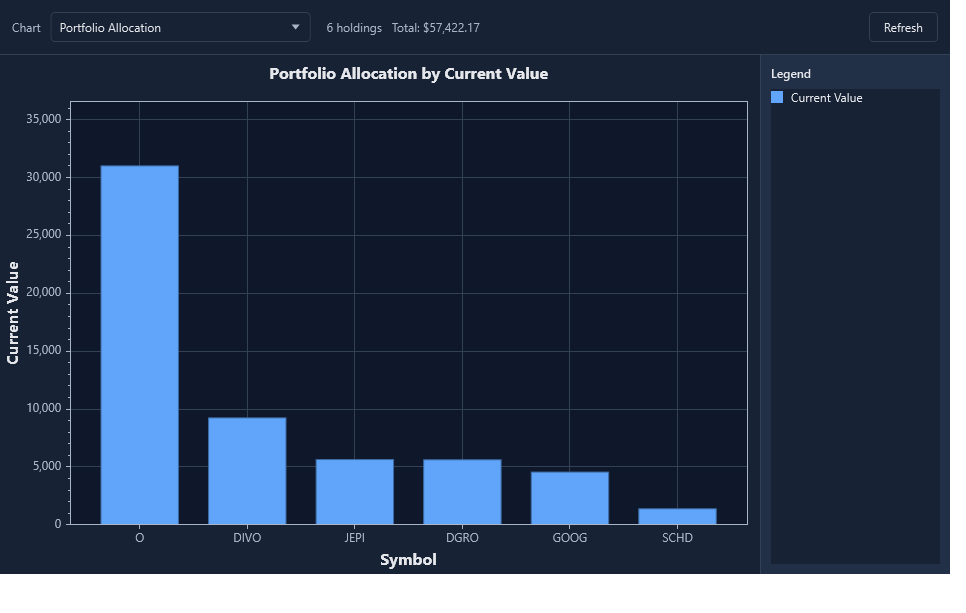
Portfolio charts show a current snapshot of the portfolio from several angles. StockTracker does not need historical prices for these charts. Select View > Portfolio Charts, then use the Chart dropdown to switch views. Hover bars or points for holding details.
Use Portfolio Allocation to see current value by holding and spot concentration.
Use Cost Basis vs Current Value to compare what you paid with what each holding is worth now.
Unrealized Gain/Loss ranks holdings by total gain or loss. Today's Movers shows each holding's value change since previous close.
Dividend Income Weight vs Portfolio Weight compares each holding's share of portfolio value with its share of estimated annual dividend income.
Compare current yield with yield on cost to see income return from today's price and original cost basis.
Use Income Efficiency Scatter to compare annual dividend income against position size.
The compact graphs beneath the portfolio Value and Value Change totals provide a quick view of recent movement without opening a chart window.
The graph beneath Value shows the portfolio's recorded total value over the range selected in Settings > Display. Click it to open Historical Charts.
The graph beneath Value Change shows the total portfolio change since the previous market close after each successful market-data fetch today. It is informational only; it does not open a full chart.
The faint dashed $0 line on the Value Change graph is the previous-close reference, not a recorded fetch. It gives the trend a consistent scale: points above it are gains for the day, and points below it are losses. Click the graph to show or hide the baseline when you want to emphasize smaller changes.
Historical Charts show how your saved portfolio metrics change over time. Open View > Historical Charts to track portfolio value, unrealized capital gain, annualized dividend, dividend yield, and yield on cost.
Each complete market-data fetch records a snapshot of the current portfolio. Both manual fetches and automatic fetches can add history; incomplete fetches do not create a snapshot.
The normal chart views aggregate recorded snapshots into one point per day, making it easier to see longer-term trends even when you fetched more than once on a day.
Choose Intraday to inspect every complete fetch from today. This is useful when you want to see how the portfolio changed during the day.
Use All History, 1 month, 3 months, 6 months, 1 year, 3 years, or a custom range. For a bounded period, use the arrows beside the date range to move backward or forward by one selected period; Refresh returns to the normal current range. Use the legend to choose which metric lines are visible.
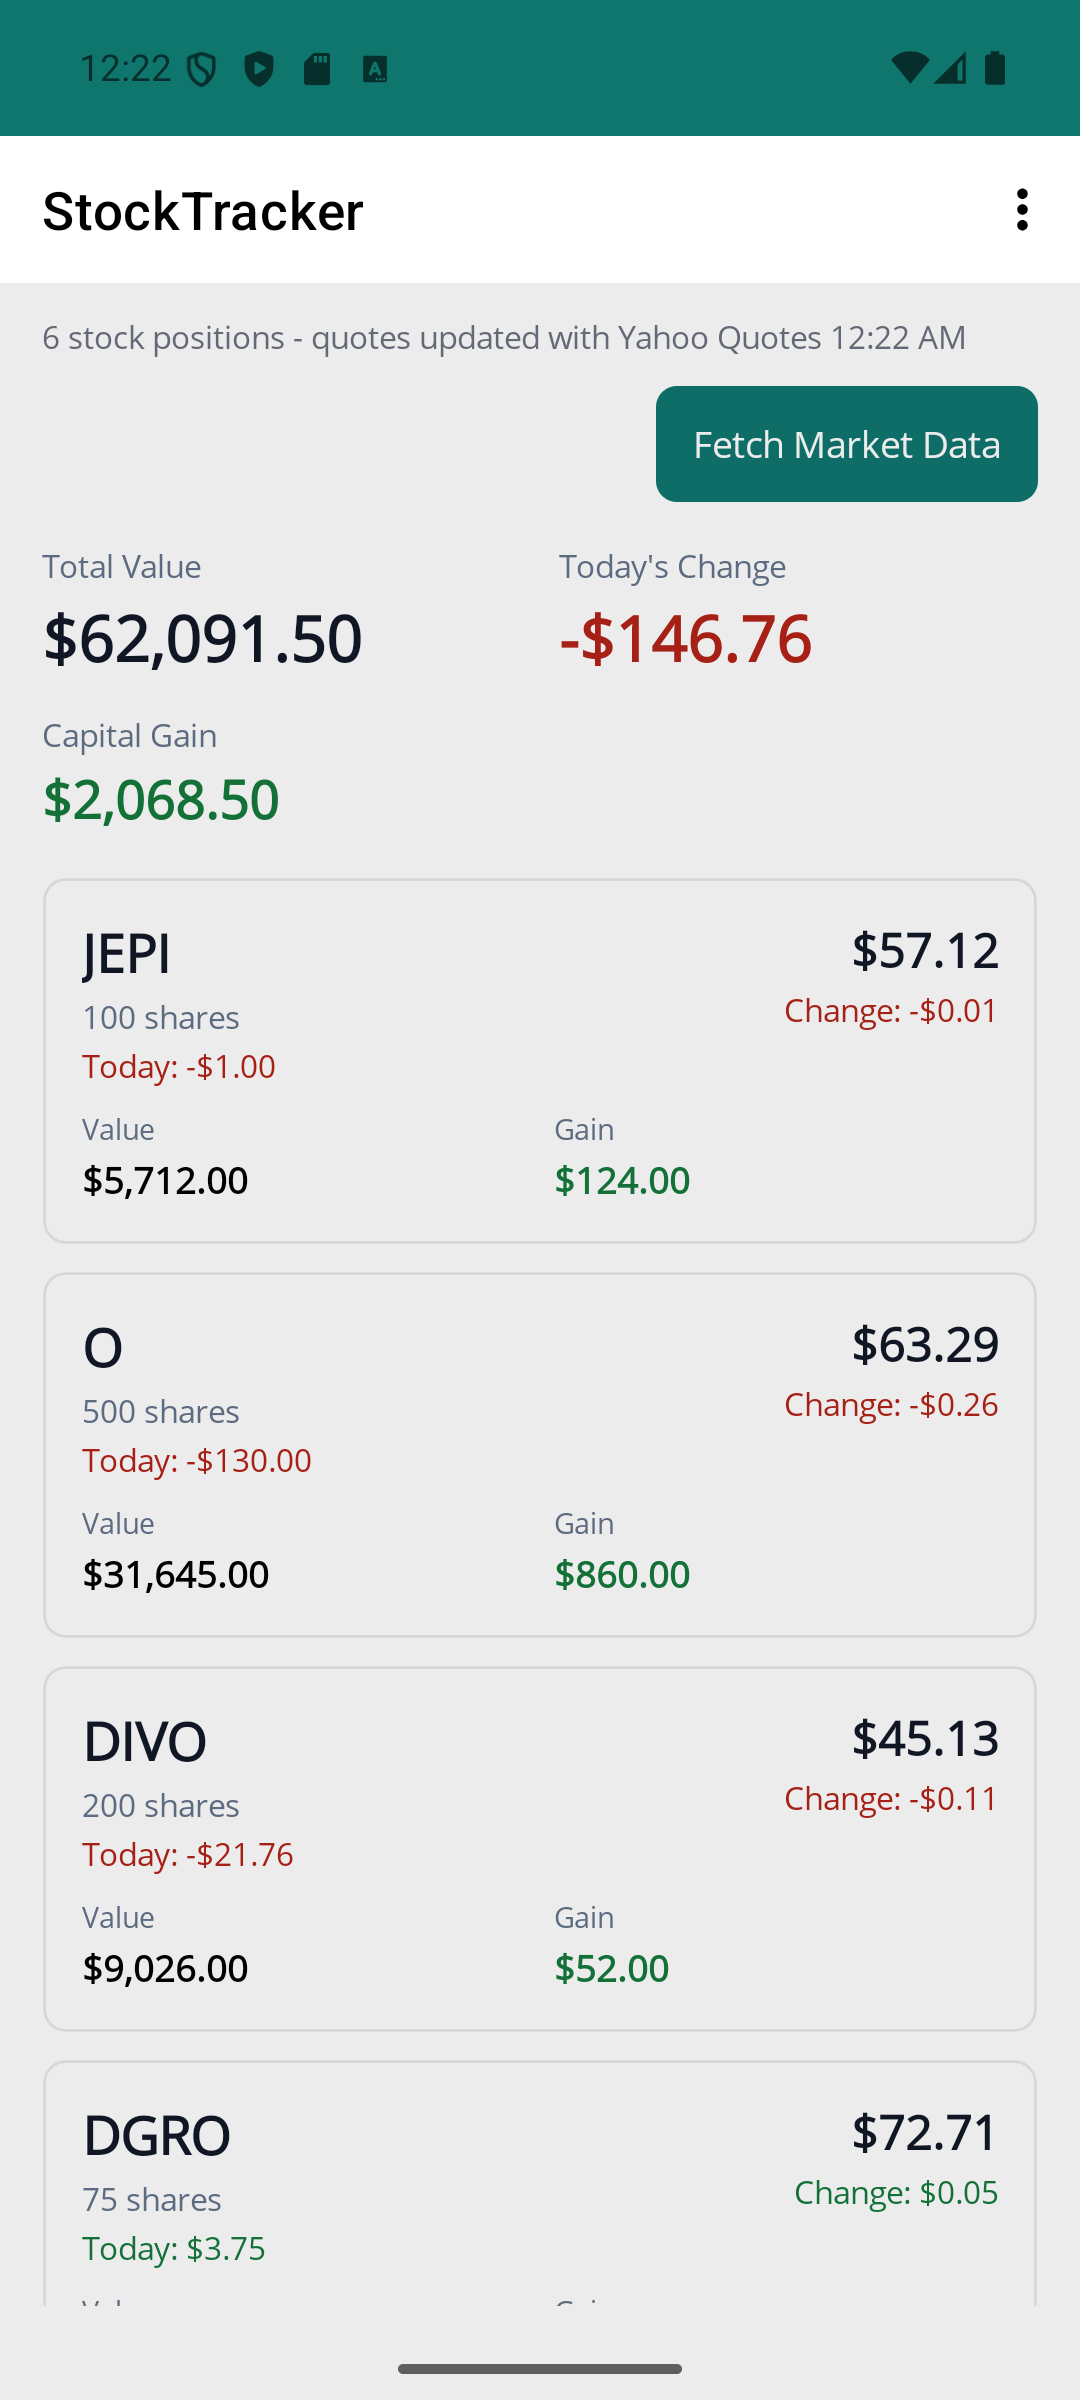
The Android app imports a read-only copy of the desktop portfolio over your local network so you can check portfolio totals and positions from your phone.
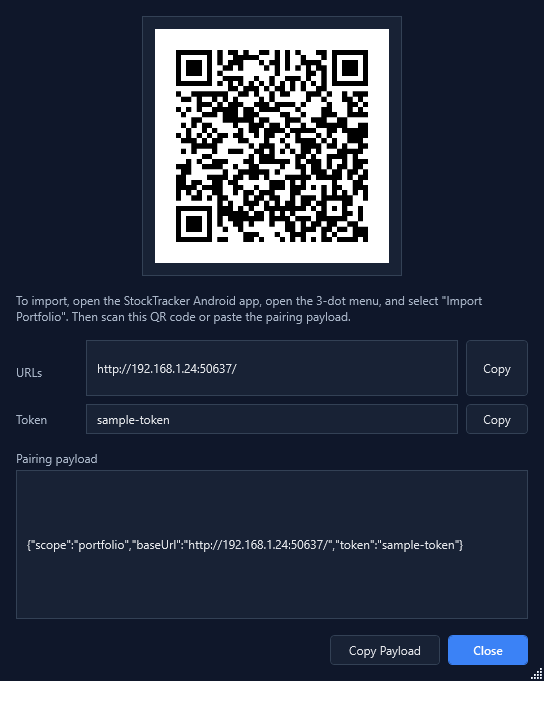
To install the companion app, open Help > About on Windows, select Get Android Companion App, then scan the QR code with your Android phone.
The companion keeps the phone view focused on portfolio totals, quote refresh status, and position cards.
Long-running actions show progress in the Status panel. Use Settings > Show/Hide Status Area or the Status panel header button to show or hide the panel, and drag the top edge of the expanded panel to resize it.
Open Settings > Quote Providers and confirm the selected provider. Alpaca Markets and CoinMarketCap require credentials; Yahoo Quotes does not.
Open Settings > Automatic Fetch and confirm that it is enabled, the day is selected, and the scheduled local time has passed. The desktop app must be running, the current portfolio must contain positions, and market-data fetching must be allowed for the current license and portfolio size. A manual or startup fetch already completed that day will prevent another automatic fetch.
Keep both devices on the same network, leave the desktop share window open, and try each listed share URL if you are pasting details manually.
StockTracker estimates dividends from the current saved dividend amount. It does not reconstruct historical dividend payments.
That is expected. Saved secrets stay encrypted and hidden. Leave the field blank to keep the saved value, or enter a new value and save again.
Portfolio files are saved as JSON files wherever you choose on your computer. StockTracker does not upload your portfolio to a cloud account.
Yes. Save each portfolio as a separate file, then use File > Open Positions to switch between them.
Yes, if you can export positions as a CSV or XLSX spreadsheet with recognizable symbol and share quantity columns. Schwab also has a dedicated importer for its positions CSV export.
Not always. Yahoo Quotes can be used without credentials. Alpaca Markets and CoinMarketCap require your own provider credentials before they can refresh prices.
No. The Android companion imports a read-only copy from the desktop app so you can view portfolio values on your phone.
StockTracker is built by a solo developer, and the ongoing app store costs and requirements for both Android and iPhone are not currently practical for the project. Android allows the companion app to be installed directly, while iPhone distribution generally requires the Apple App Store, so there is no iPhone companion app at this time.
The portfolio can still open, and you can import or reduce positions, but market data fetching is disabled until the portfolio has 5 or fewer positions or a license is activated.
No. StockTracker organizes portfolio information and estimates dividend income. It is not financial, investment, tax, or legal advice.
Enter the Payhip license key in StockTracker's license or activation dialog. The paid license unlocks unlimited positions. Each license includes three total fresh activations; legitimate activation problems can be reviewed by support.
Payhip provides your license information. Enter the license key in the Windows app. The Android companion is included and does not require a separate StockTracker license.
The StockTracker installer is not currently digitally signed, so Windows may show “Windows protected your PC” when you open it. This is a publisher-verification warning, not by itself a malware finding. Download only from the official source, then select More info and Run anyway if you choose to continue. See Windows Installation Warning for the full guidance.
Updates are free for free-mode and paid users. StockTracker checks for available updates and lets you choose whether to download and install them. Internet access is needed to check for and download updates and to retrieve market data, but not to install an update that has already been downloaded.